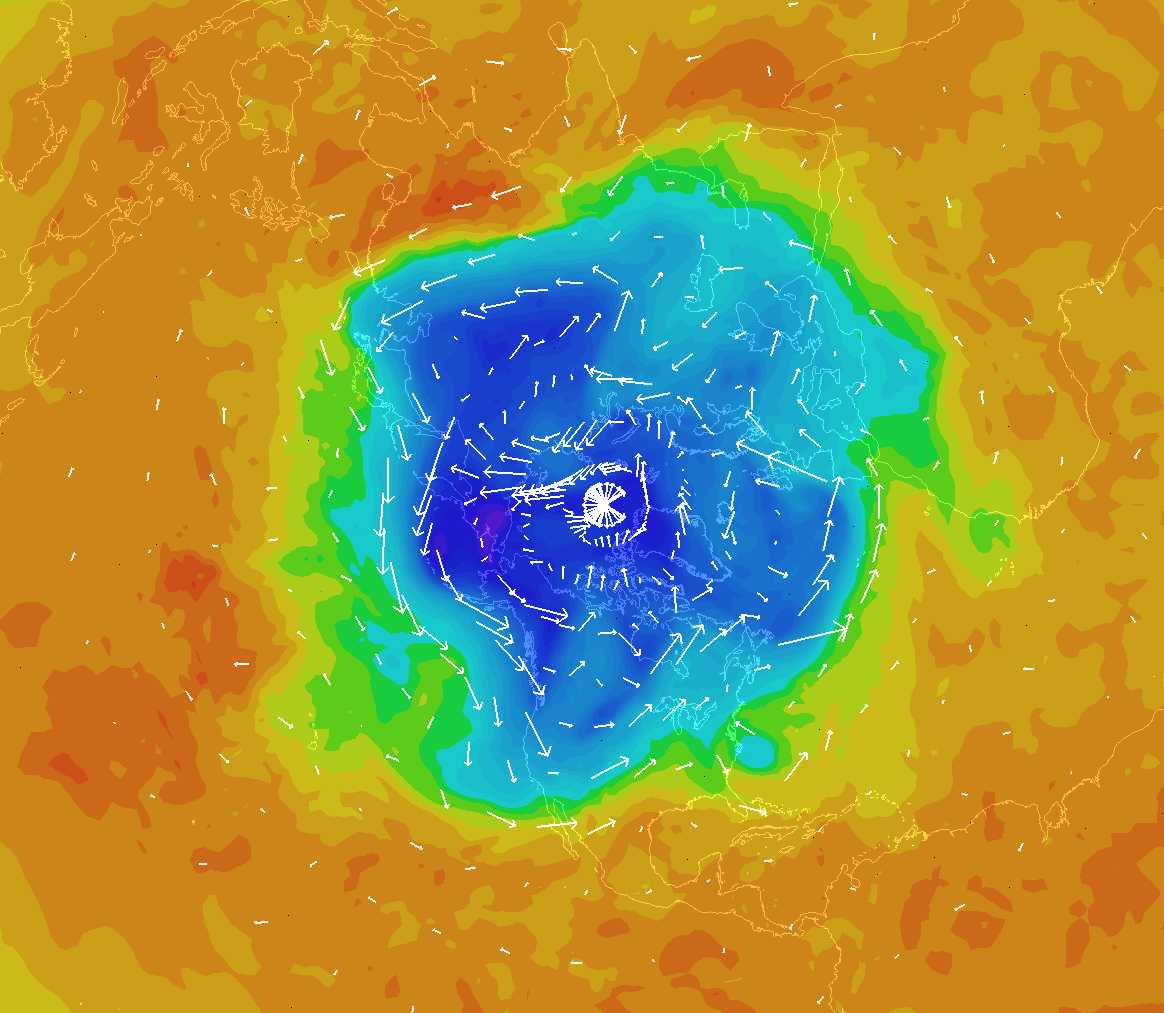
500 mb Potential Temperature & Wind Vectors --- Bundle |
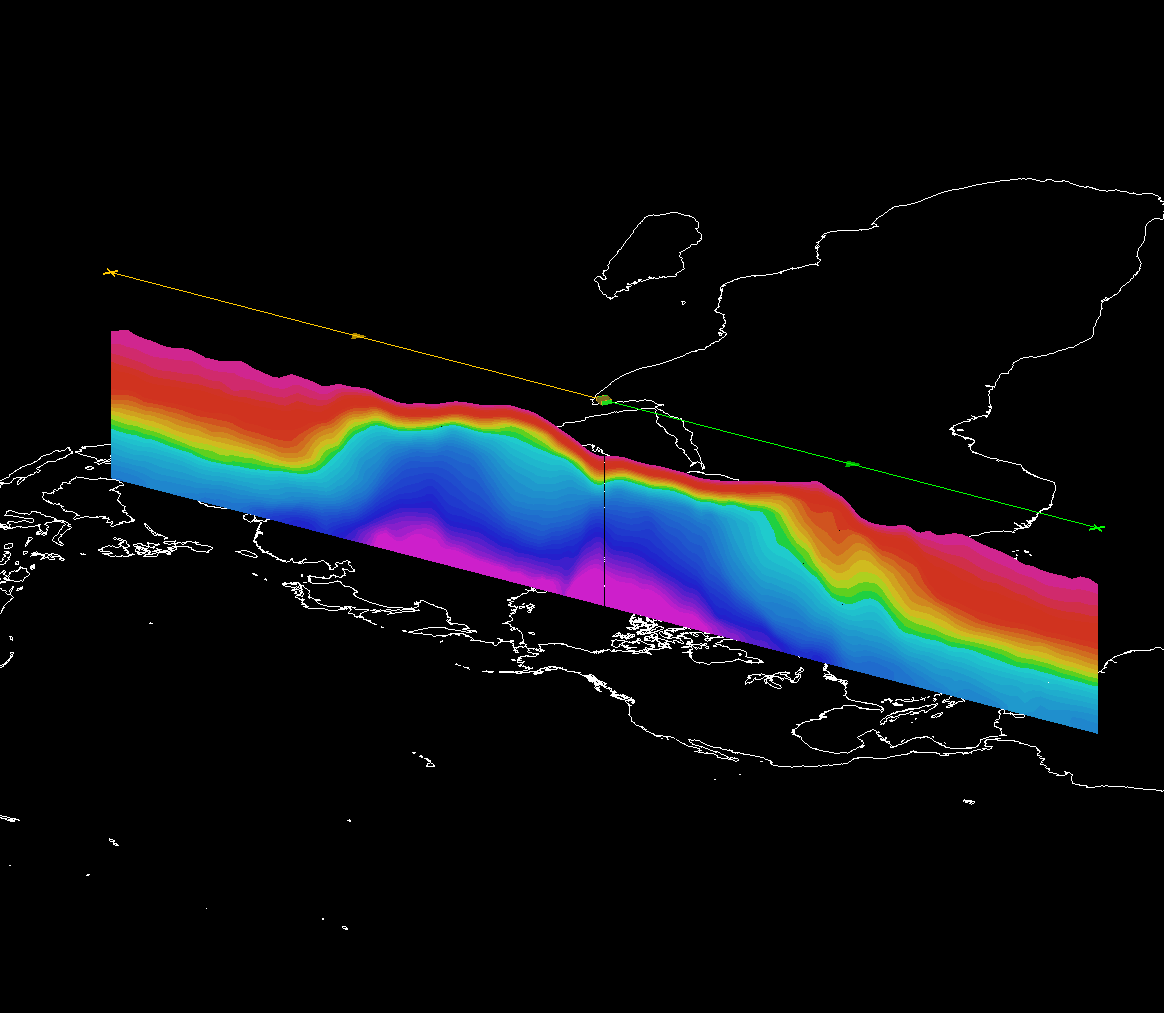
Potential Temperature Cross Section (Angled View) --- Bundle |
|
|
|
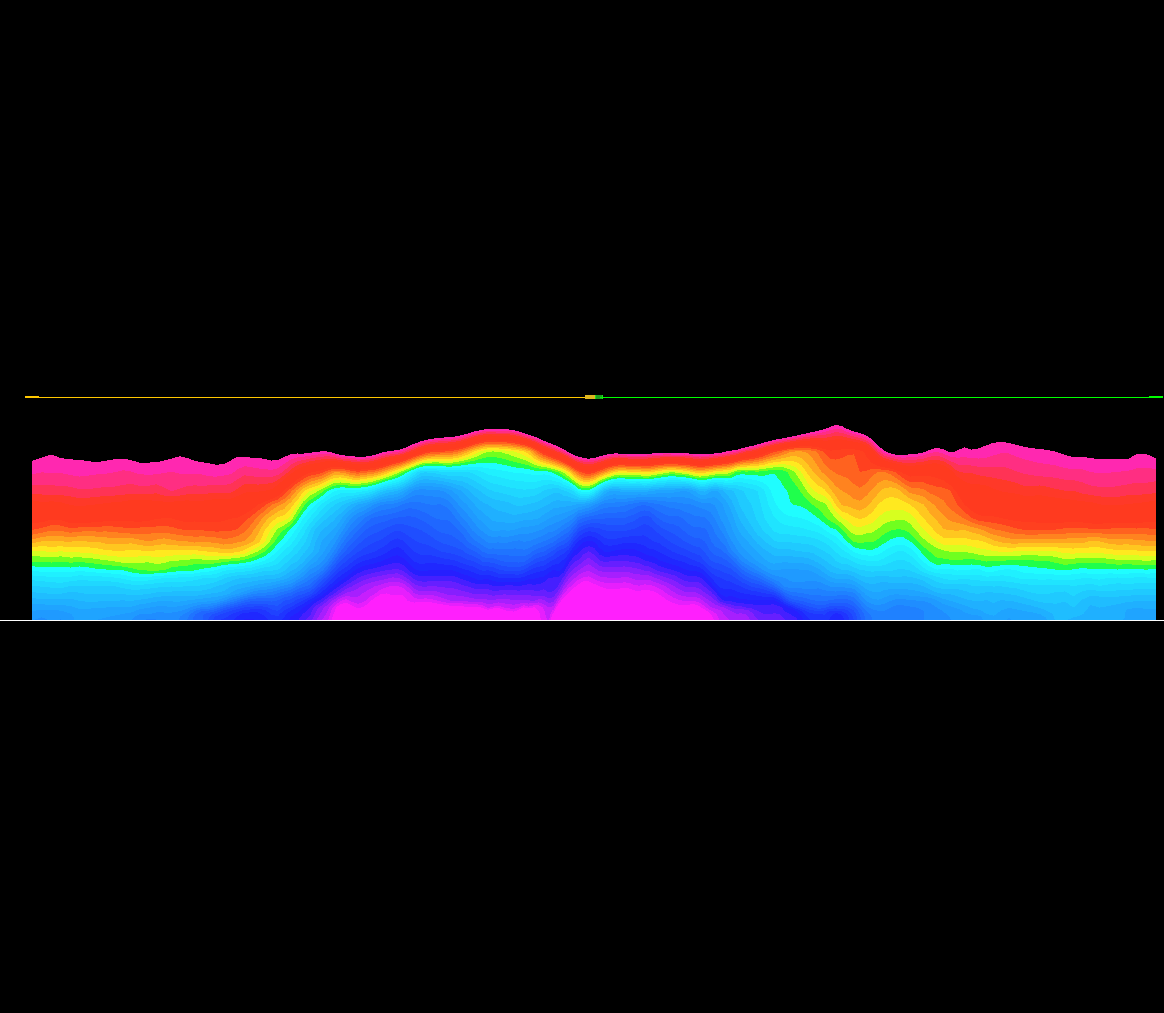
Potential Temperature Cross Section (Head-On View) --- Bundle |
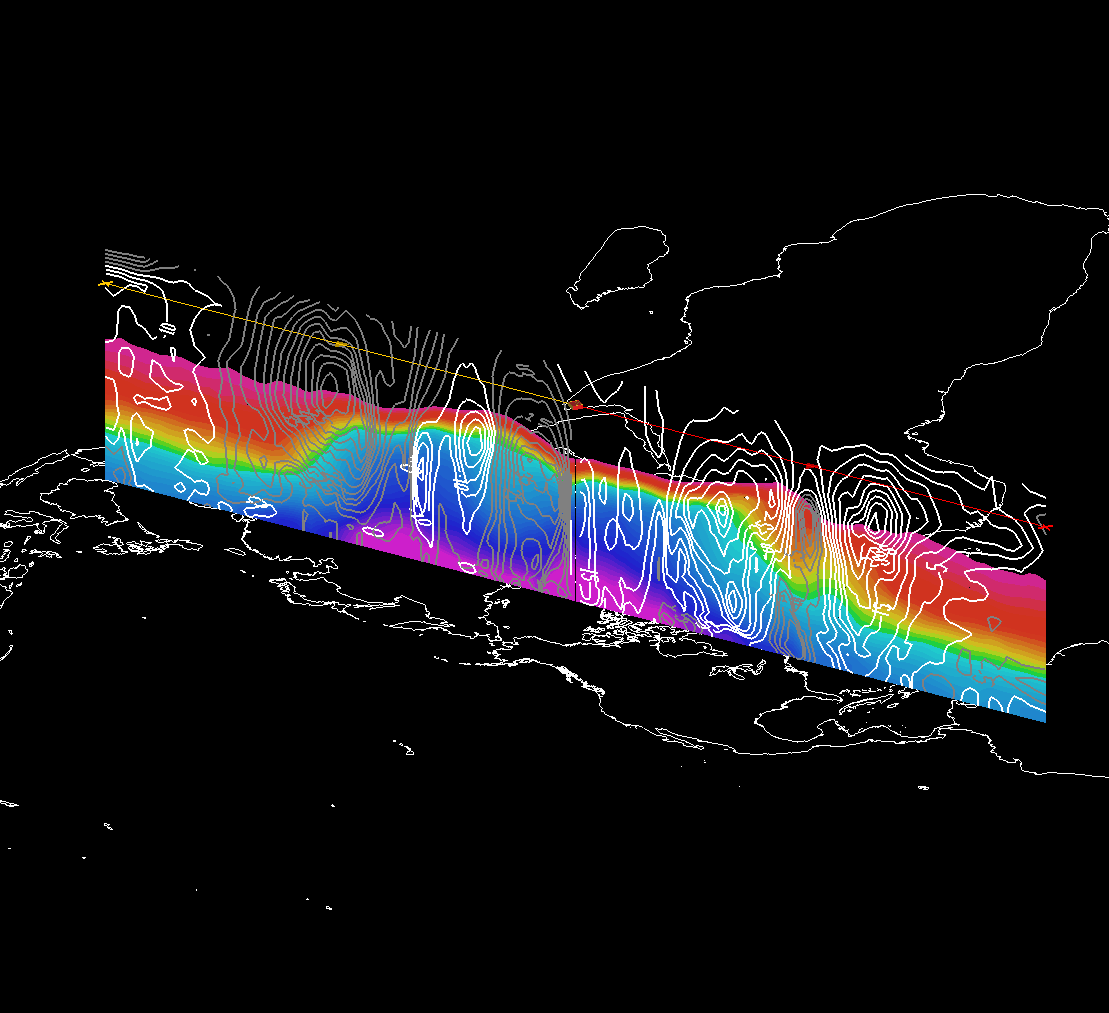
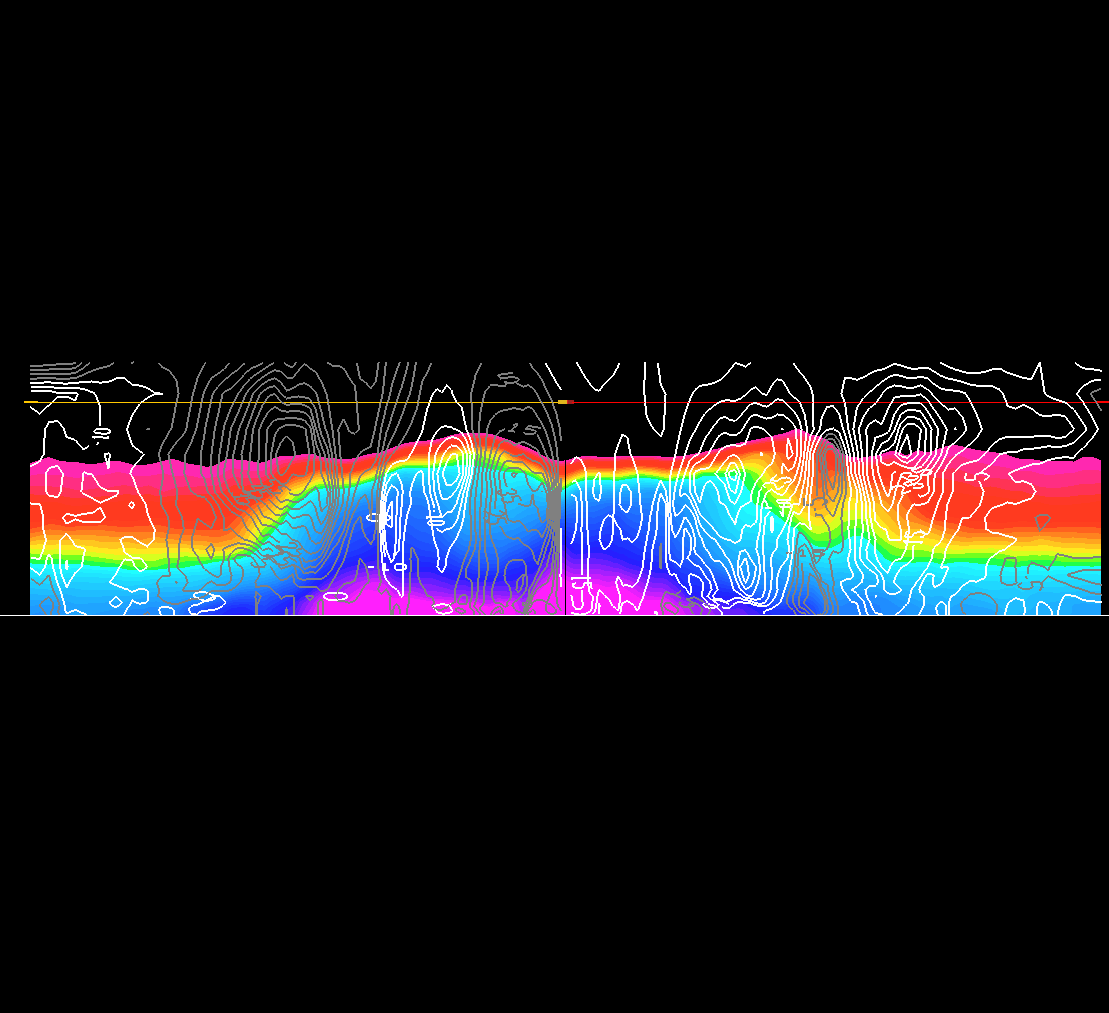
Potential Temperature & U-wind Cross Section (Angled View) --- Bundle |
 |
 |
Potential Temperature & U-wind Cross Section (Head-On View) --- Bundle |
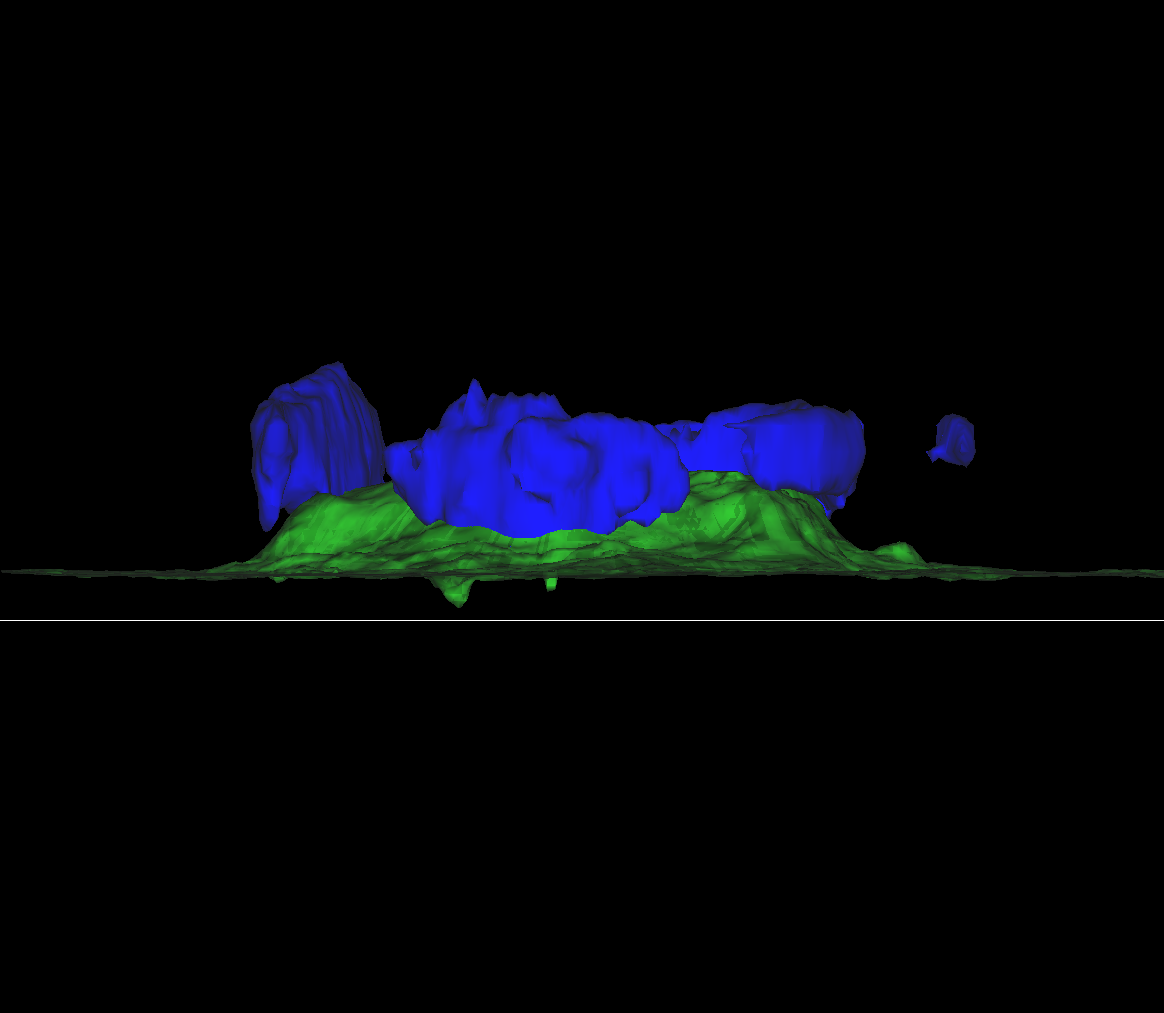
Potential Temperature Isosurface (315 K, Angled View) --- Bundle |
 |
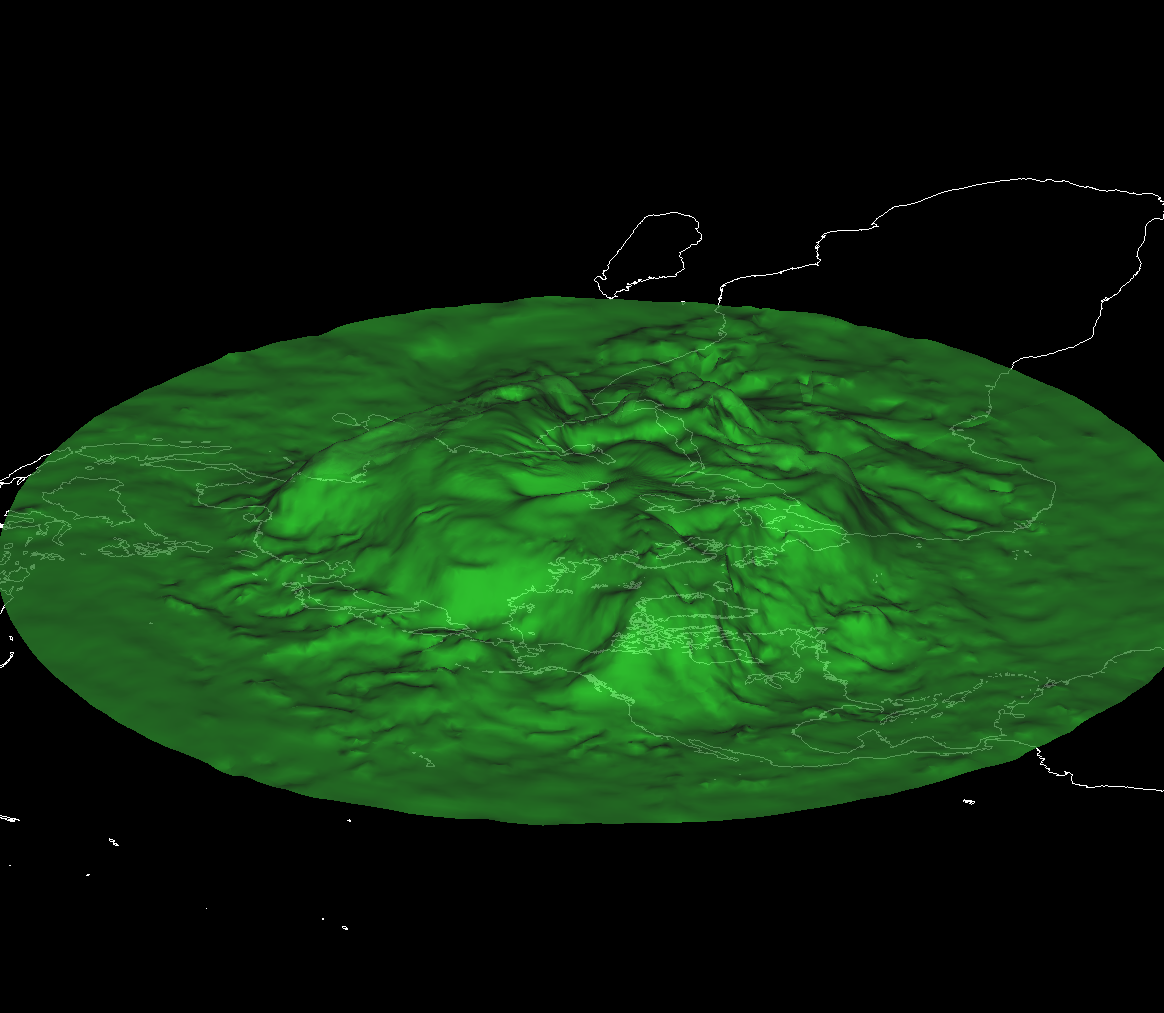 |
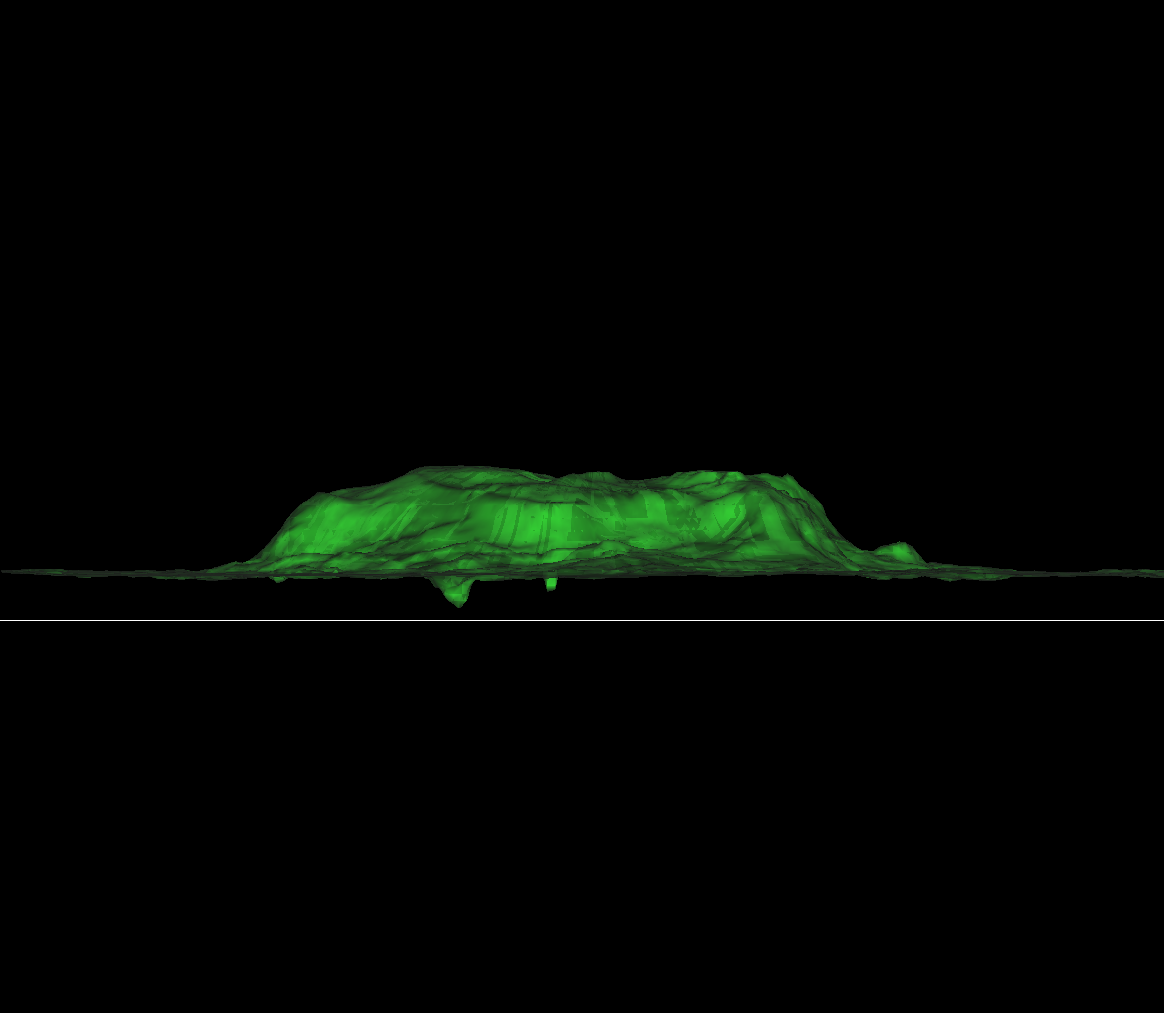
Potential Temperature Isosurface (315 K, Head-On View) --- Bundle |
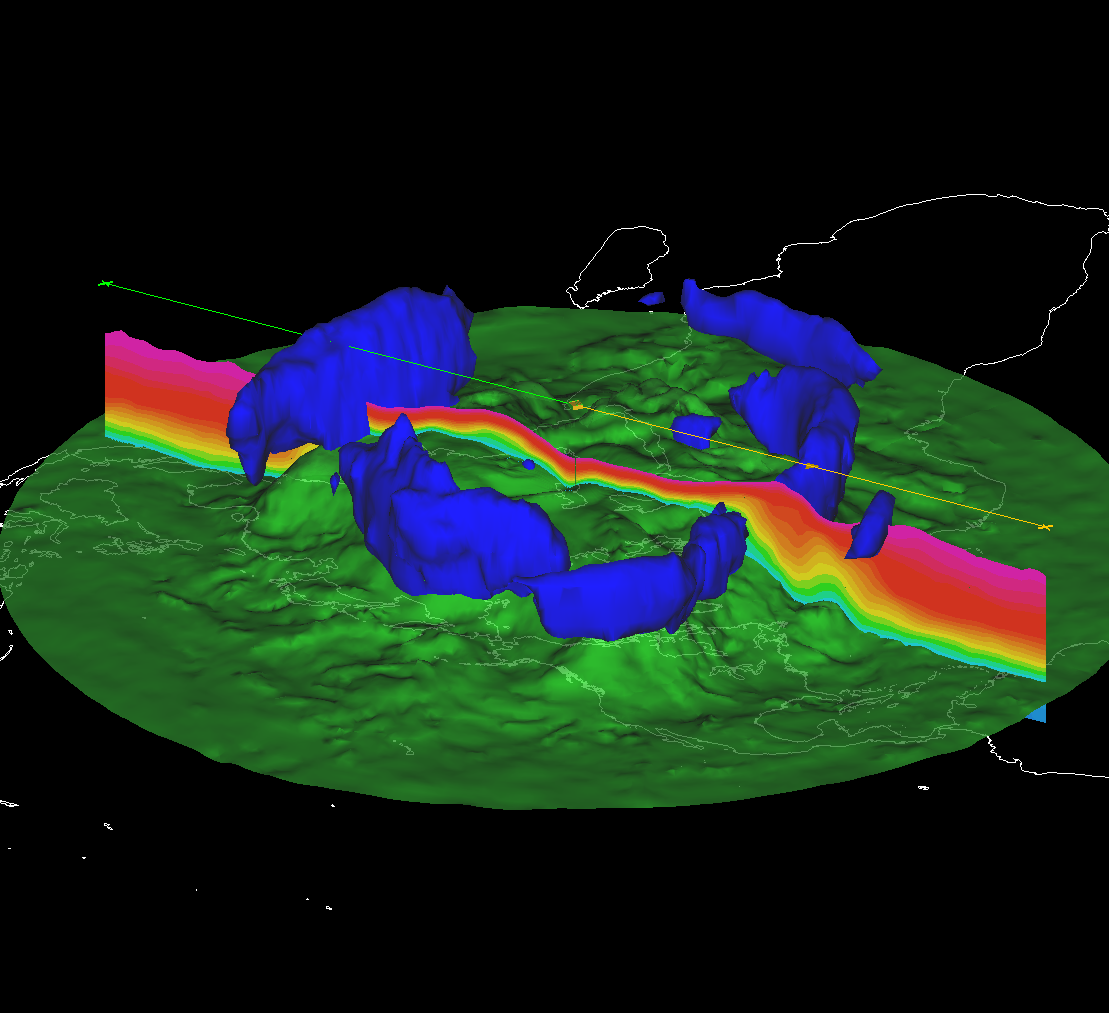
Potential Temperature & U-wind Isosurface |
 |
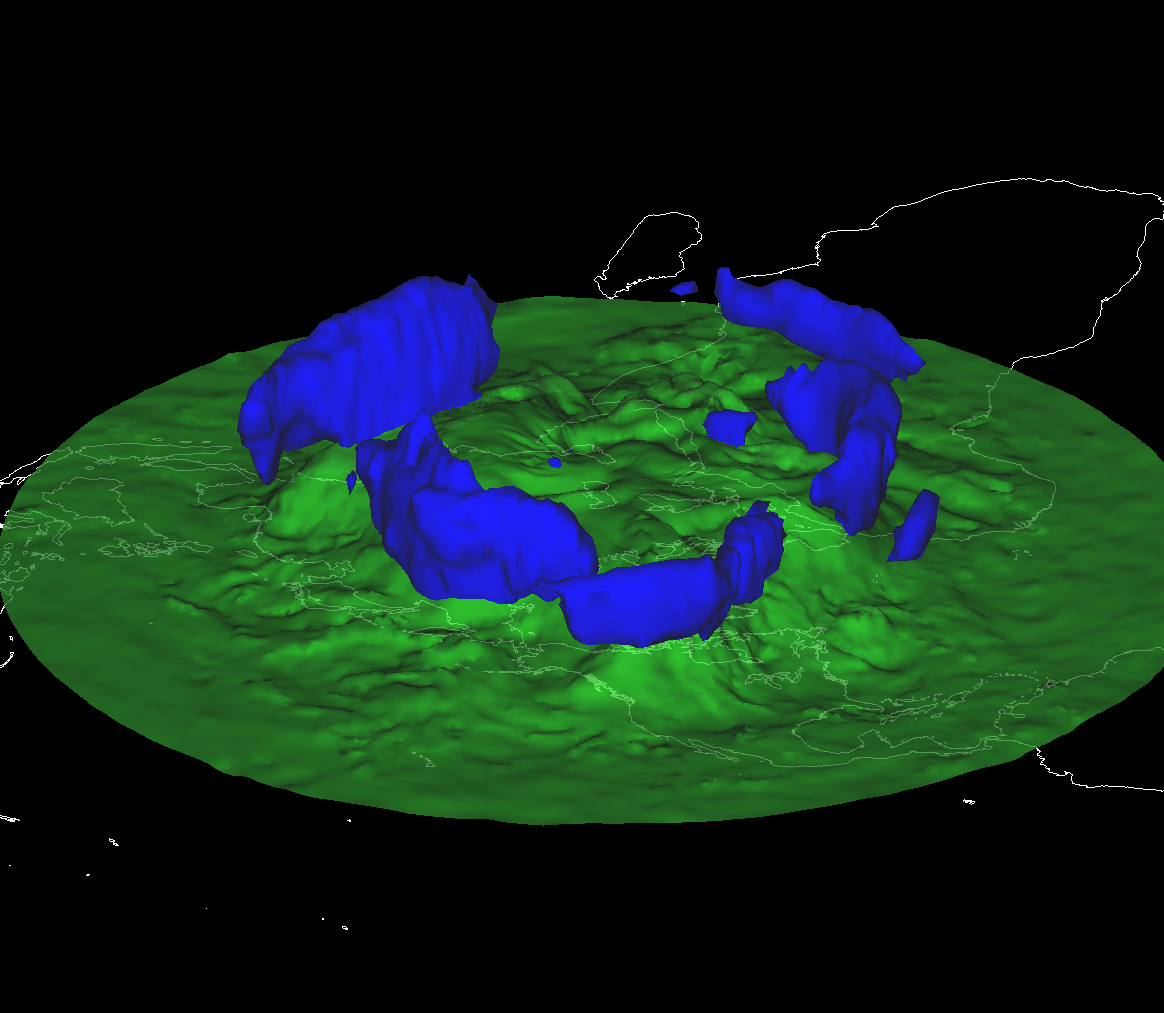 |
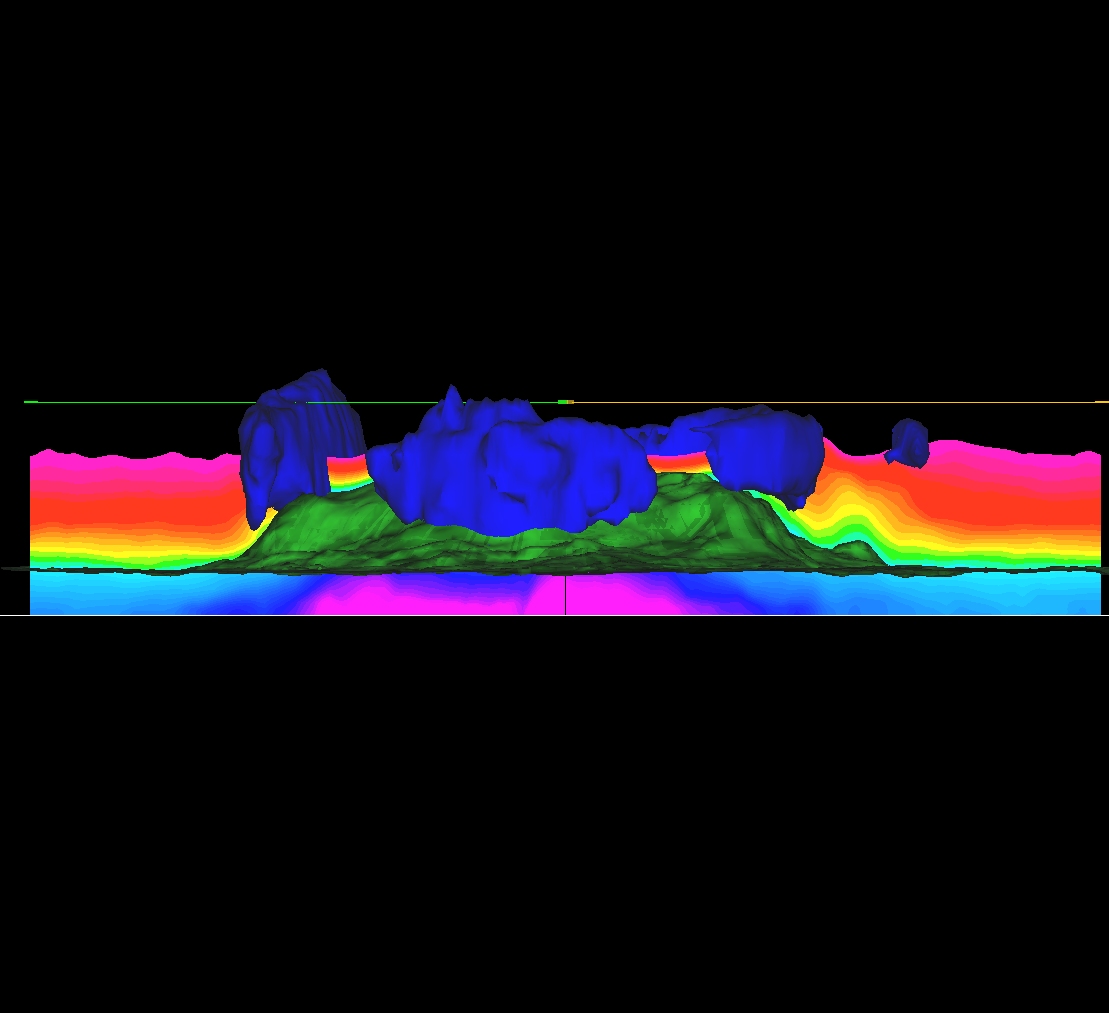
Potential Temperature & U-wind Isosurface |
Potential Temperature & U-wind Isosurface |
 |
 |
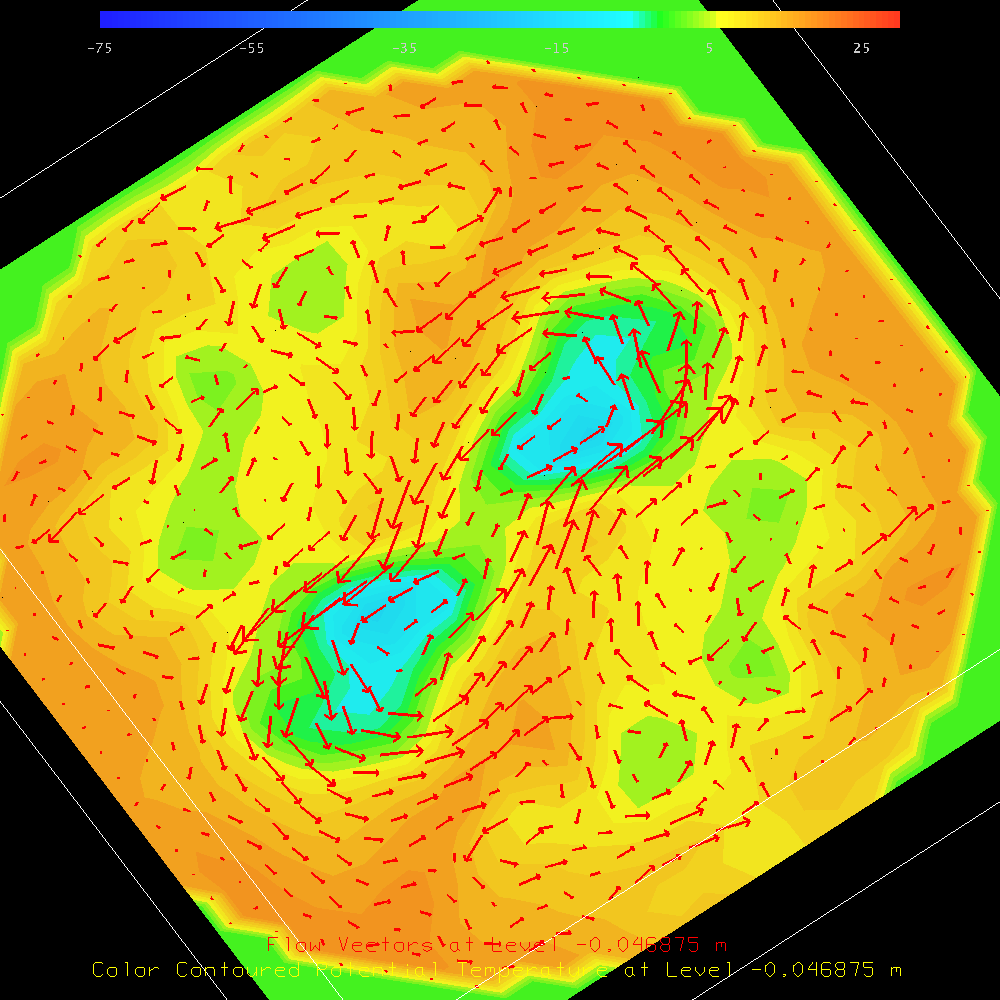
Scripting in JythonAll functions in the IDV may be called through Jython scripts. Thislanguage provides much more flexibility in specifying parameters for displays of atmospheric data. The example script at right uses an MIT circulation model as the data source. The script then takes various inputs from the user and produces an image of horizontal potential temperature and accompanying wind vectors. A web interface will run the script and produce images from the user's choices. A wide range of display options are documented throughout the script's code. NOTE: This script can always be improved, hence there are some comments of this nature too. |
Jython Script (2dhzt.py) - Horizontal Slice of Pot. Temp. & Wind Vectors
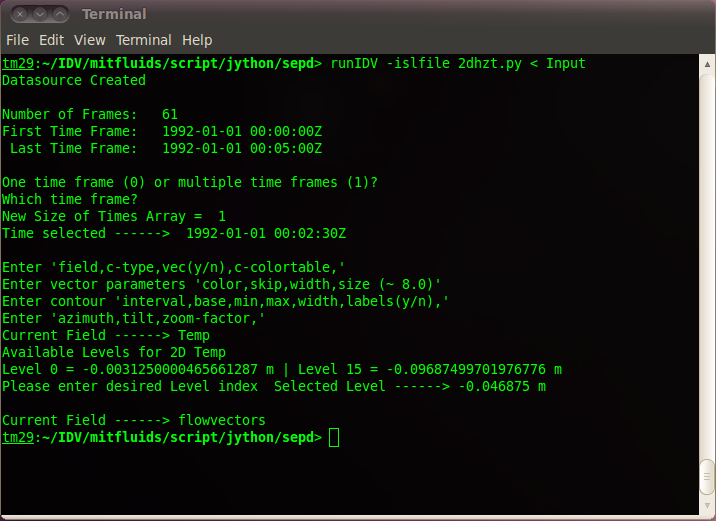
The following Linux command runs the script:
runIDV -islfile 2dhzt.py < Input
The Jython script (in the link above) takes in arguments to plot potential temperature contours and arrows for wind vectors. This set of inputs is described below: 0 = Selects only one time frame (no animation) 30 = Selects time frame 30 (indexed from 0 to 60) theta,color,y,---, = Data Field, Contour type (line or color),Wind Vectors?(y/n),Colortable (for line contour) red,0,3,14, = Vector: Color, Skip, Width, Length 2,0,-75,30,2,n, = Contour: Interval, Base, Minimum, Maximum, Width (for line contour), Labels?(y/n) 35,23,1.95, = Azimuth, Tilt, Zoom-Factor 7 = Selects data from level 7 (indexed 0 at top, 15 at bottom) |
|
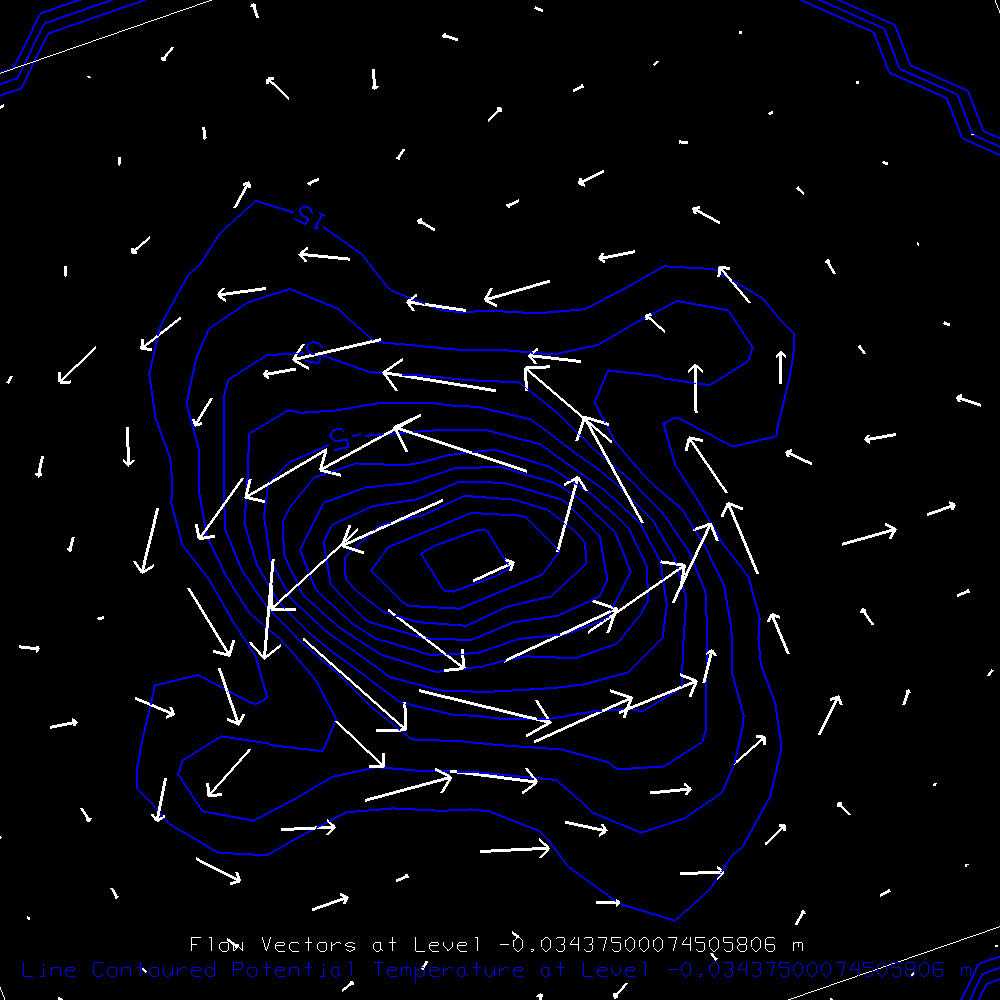
Click on the image below to see a loop, generated with
Input3.
Note that the 1st line of Input3 is a 1, which creates a loop. The 2nd and 3rd lines are the first and last frames respectively. 
This site maintained by Roman Kowch Last updated on 05/02/2011 |