Papers, Data, and Graphics Pertaining to Tropical Cyclone Trends and Variability (Updated through 2009)
Atlantic
hurricane trends linked to climate change. EOS, 87, 233-244. Online
supplement available here
Atlantic tropical
cyclones revisited. EOS, 88, 349-350
Environmental
factors affecting tropical cyclone power dissipation. J. Climate, 20,
5497-5509
The
Hurricane-Climate Connection. Bull. Amer. Meteor. Soc.,
89, ES10-ES20
Excel spreadsheet with Atlantic sea surface temperature and hurricane power dissipation, 1949-2009
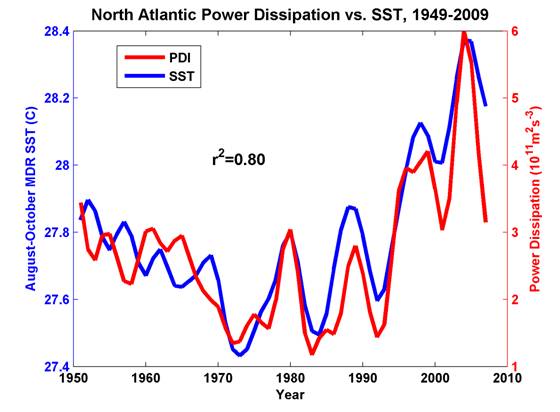
The graph below shows the Atlantic tropical cyclone power dissipation and Main Development Region (MDR) sea surface temperature (SST) from 1949 to 2009, inclusive. Both quantities have been smoothed using a 1-3-4-3-1 filter. The SST is shown in blue, while the power dissipation index (PDI) is shown in red. Here the MDR is defined as the region bounded by 6N and 18N, and 20W and 60W; the SST data is the HADISST1 data set from the U.K. Hadley Center, and it has been averaged from August through October of each year. The two time series are correlated with an r2 of 0.80. Note that both the smoothed sea surface temperature and the smoothed power dissipation have declined since their peak in 2005, consistent with previous decadal time scale variability in both series.
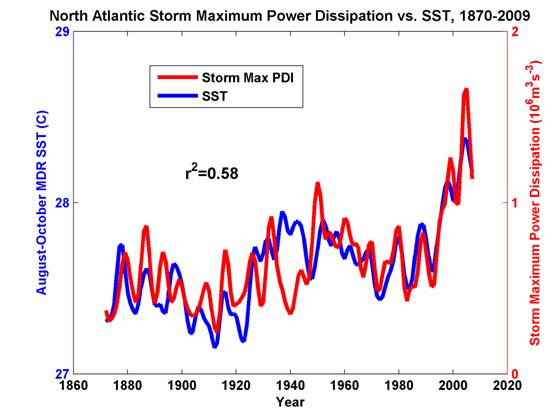
The next graph compares the smoothed time
series of August-October SST to the smoothed time series of “storm maximum
power dissipation”, which is just the sum over each year of the cube of the
storm lifetime maximum wind speeds. These series are compared from 1870 to
2009. The reasoning here is that lifetime peak wind speeds are more likely to
be accurately estimated than power dissipation, which depends on the whole
lifetime history of wind speeds. In the modern era (1970-2009), Atlantic
smoothed storm maximum power dissipation and smoothed total power dissipation
are highly correlated (r2=0.93). Note that smoothed storm maximum
power dissipation is well correlated with smoothed sea surface temperature for
the duration of the record, with a notable discrepancy during World War 2.