This page shows sensitivity calculations for the 2001
WSR Program, done retrospectively.
The calculations use the rescaled,
rawinsonde/satellite version of the ET KF, which is currently
implemented at NCEP for WSR 2003. Rescaled means
that the ensemble perturbations at the targeting
time have been adjusted such that the average signal
variance at the targeting time is equal to the average
squared NCEP signal (at least for the 2001 WSR data!).
Rawinsonde/satellite means that the ET KF
considers the routine observational network to be a combination
of northern hemisphere rawinsondes and
satellite observations.
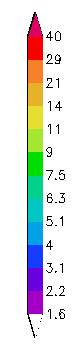
The following table shows summary maps and signal variance
evolution charts associated with the
17 observing missions that were carried out. Most
observations were taken to improve the forecast
for multiple events; hence, the multiple summary maps
for a single targeting time. Summary maps
are identified by their verification time in the table.
For each targeting time there is one particular
evolution of the signal variance. Here, some of
the longer ones are broken up into two figures
for convenience. On these maps, only the last verification
region is drawn.
|
|
|
|
|
|
|
|
|
|
|
|
||
|
|
|
|
|
||
|
|
|
|
|
||
|
|
|
|
|
|
|
|
|
|
|
|
||
|
|
|
|
|
|
|
|
|
|
|
|
|
|
|
|
|
|
|||
|
|
|
|
|
|
|
|
|
|
|
|
||
|
|
|
|
|
|
|
|
|
|
|
|
||
|
|
|
|
|
|
|
|
|
|
|
|||
|
|
|
|
|
||
|
|
|
|
|||
|
|
|
|
|
** Click here for the signal variance evolution charts color bar **
The links below show statistical plots analyzing the performance
of the rescaled, rawinsonde/satellite
version of the ET KF for all 17 observing missions of
the 2001 winter season.
The targeting time scatter
plot shows the predicted ET KF signal variance versus the squared NCEP
signal
(squared difference between the forecast using targeted
obs. and the exact same forecast but without the
targeted obs) for all the rawinsonde drop locations.
Equally populated bins are shown as well, with the top
of the bin equal to the NCEP signal variance for that
bin. This plot should give an idea of the range of
ET KF signal variance (e.g. , on the signal variance
evolution charts) at the targeting time.
The verification time
scatter plot is constructed similarly to the targeting time scatter
plot, but instead uses
data pairs (ET KF predicted signal variance and NCEP
signal, as defined above) from all the gridpoints in the
31 verification regions. This plots should give
an idea of the range of ET KF signal variance at the verification
time. Note that the magnitude of the ET KF signal
variance is somewhat dependent on time, as the ET KF
predicted signal variance generally grows as lead time
increases.
Page created by Jon Moskaitis: jonmosk@mit.edu