Case Study of a Severe Storm
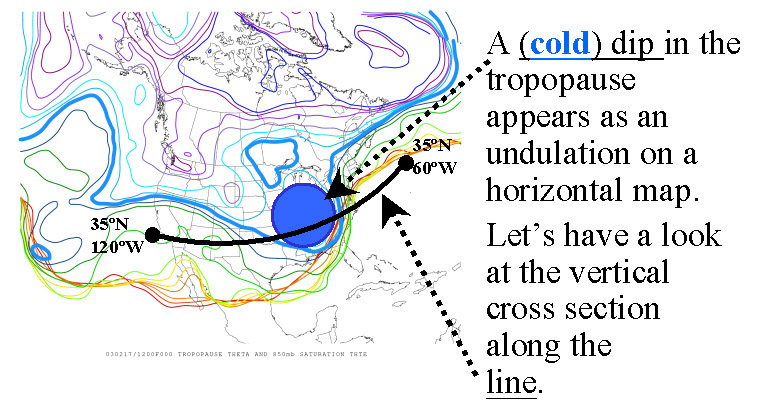 Potential temperature on the tropopause defined as a constant PV surface at 12GMT on February 17, 2003. High/warm tropopause is indicated by red, and low/cold tropopause by blue. |
|
| |
|
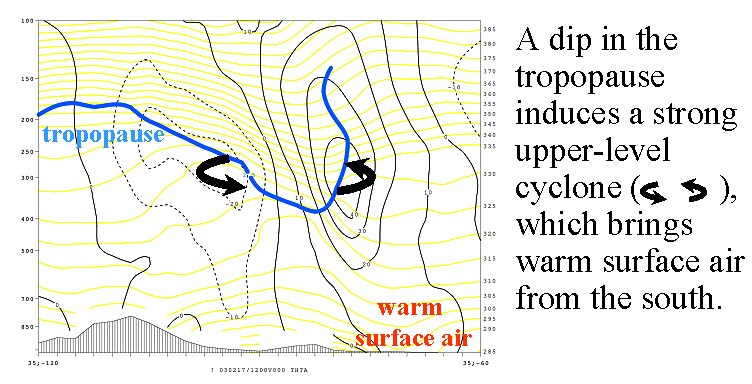 Vertical section of the storm on Feb. 17, 2003 along the line in the previous figure (35oN). Shown are a constant PV surface (blue), the potential temperature (yellow), and the meridional wind (black). Warm surface air can be inferred from the dip in the potential temperature contours. |
|
| |
|
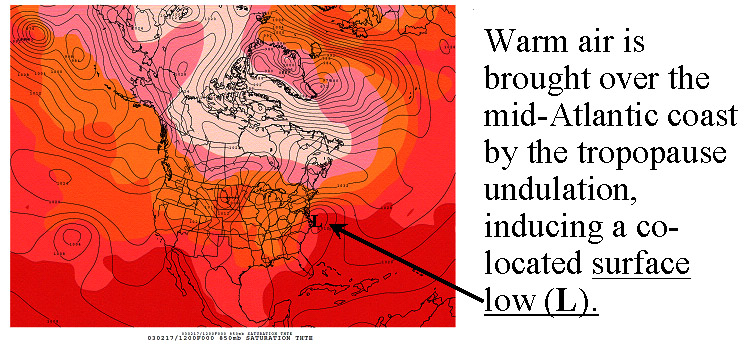 850hPa saturation equivalent potential temperature (from red to orange to pink), and surface pressure (black) at 12GMT on February 17, 2003. |
|
| |
|
|
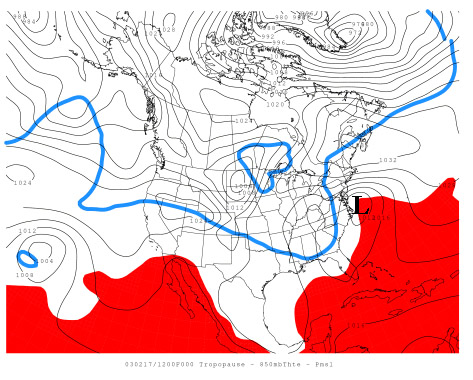
This map summarizes our discussions.
The cold (low)
tropopause and warm
surface air induce a surface low
(L) system.
Tropopause (blue) on a constant potential temperature surface, warm 850hPa saturation equivalent potential temperature (red), and surface pressure (b lack) at 12GMT on February 17, 2003. |
|