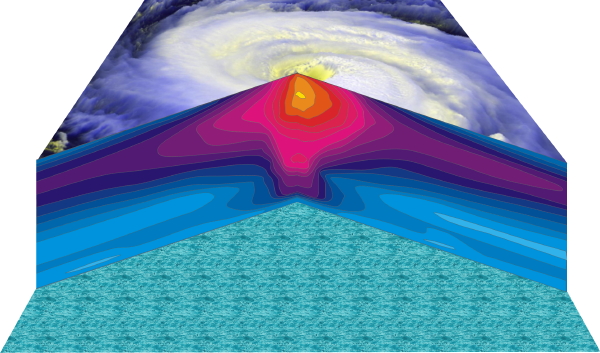
Figure 2.6, middle: Composite view of the distribution of temperature perturbation in a hurricane
Back